
The Dashboard is your central hub for analytics and performance monitoring.Documentation Index
Fetch the complete documentation index at: https://docs.chatzy.ai/llms.txt
Use this file to discover all available pages before exploring further.
It provides a high-level overview of your AI agents’ activity while also allowing you to dive deeper into detailed statistics and trends.
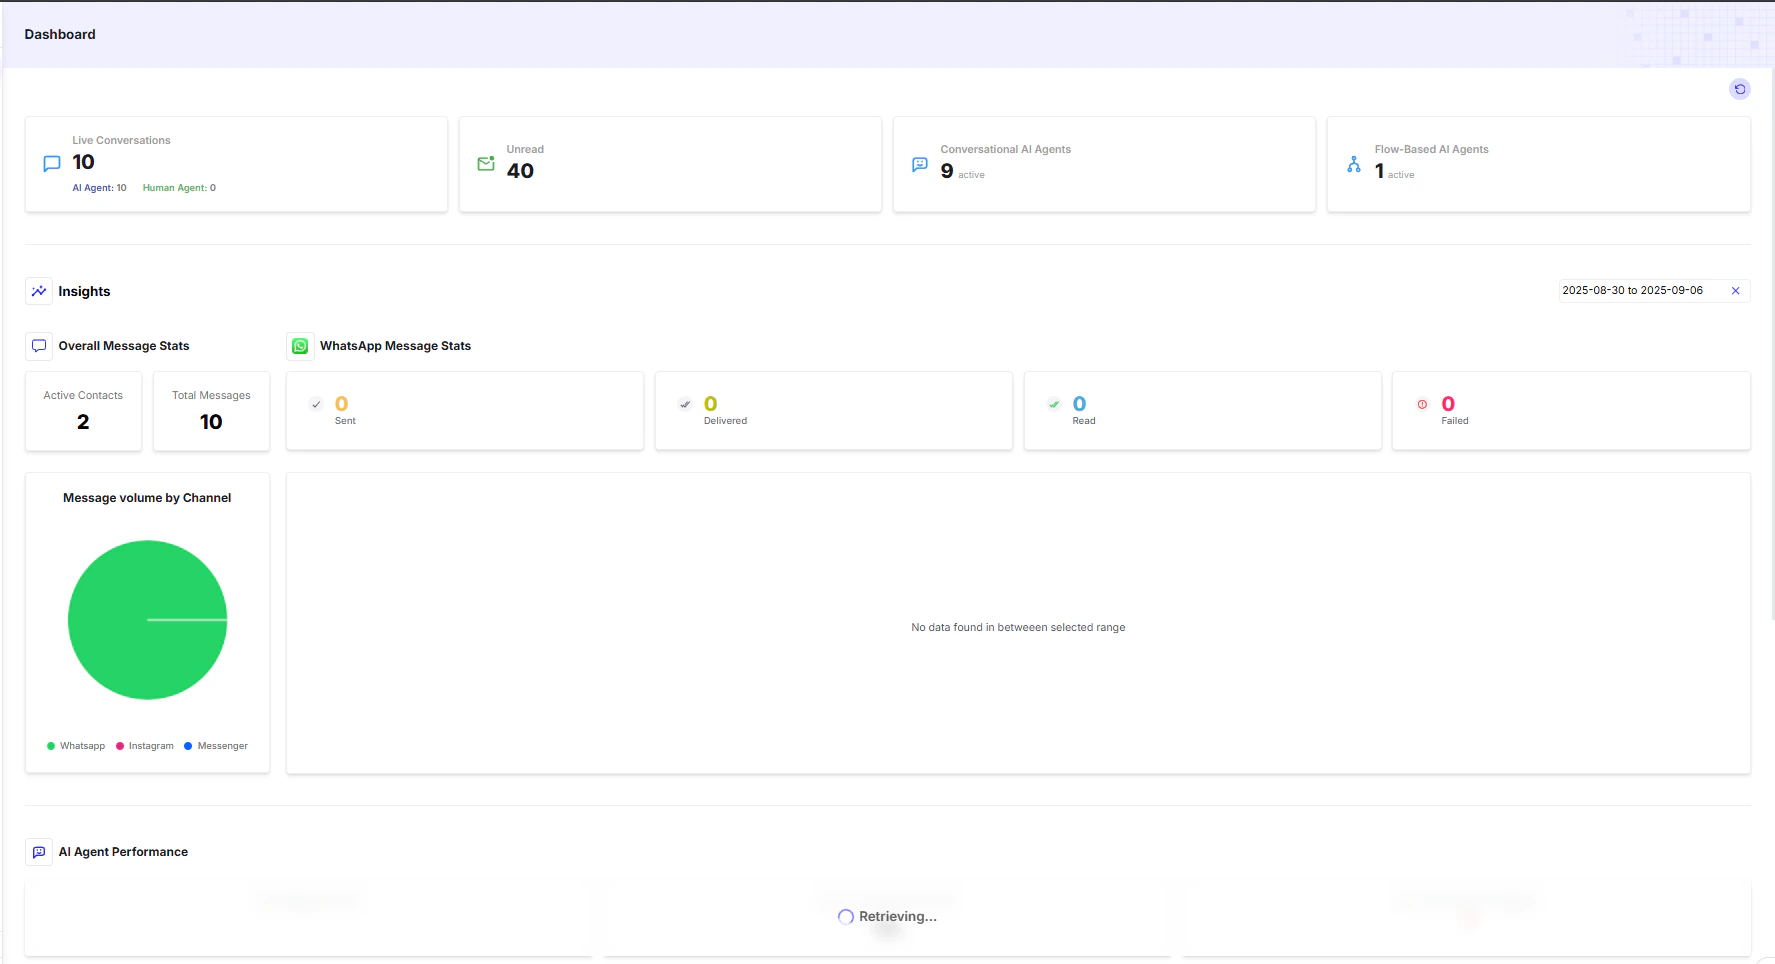
Key Metrics
The top section of the dashboard gives you a quick snapshot of your agent’s current performance:- Live Conversations → Number of conversations that are currently active in real time.
- Unread → Total conversations that have not been opened or reviewed yet.
- Conversational AI Agents → Count of general-purpose AI agents live on your workspace.
- Flow-Based AI Agents → Count of journey-driven (structured flow) AI agents.
Insights
The Insights section provides deeper visibility into your chatbot’s message flow and performance metrics:- Overall Message Stats → Tracks overall engagement with numbers like
Active ContactsandTotal Messages. - WhatsApp Message Stats → Breaks down platform-specific messaging activity:
- Sent → Messages sent from the platform.
- Delivered → Messages successfully delivered to the recipient’s device.
- Read → Messages opened/read by the recipient.
- Failed → Messages that were not delivered (e.g., due to network or platform issues).
- Message Volume by Channel → A graphical breakdown of message traffic across all connected channels (WhatsApp, Instagram, Messenger, etc.).
Performance & Details
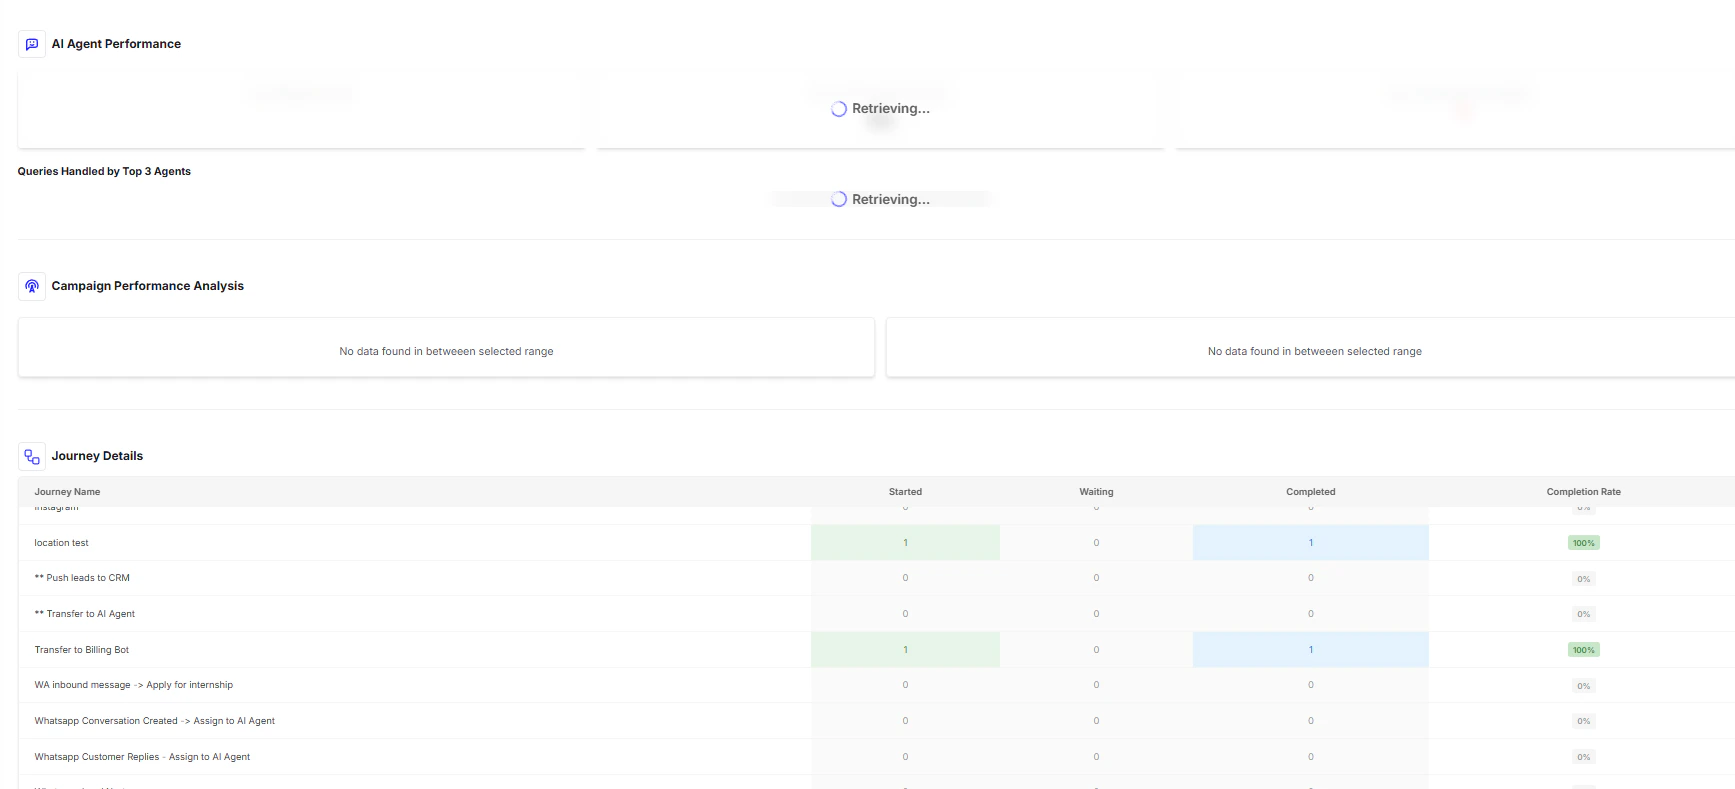
At the bottom of the dashboard, you’ll find advanced analytics that help you monitor effectiveness at a granular level:- AI Agent Performance → Individual analytics for each agent, showing which bots are most effective.
- Campaign Performance Analysis → Insights into outbound campaign effectiveness, message delivery, and user engagement.
- Journey Details → A detailed table tracking the lifecycle of each conversational journey:
- Journey Name → The title of the journey flow.
- Started → Number of times the journey was initiated.
- Waiting → Journeys currently paused at a “Wait” step.
- Completed → Journeys successfully finished.
- Completion Rate → % of journeys completed vs. started.
💡 Tip: Use the Message Volume by Channel chart to identify which platforms your users engage with most, then optimize campaigns and agent strategies accordingly.